The Challenges of a Global Expedition to Glaciers and Ice Caps
Sampling the surface snows of glaciers and ice-caps presents a number of practical problems for GAPS 24-25. Aside from the weather in the polar regions and the altitude in the alpine ones, global warming means that there are fewer glaciers than there used to be and those that remain have receded. Even where glaciers remain, there may not be much snow cover. During the HLR 2022 expedition, the glaciers were often completely dry - we could be in the right place at the right time with the right equipment but there was no snow to sample.
Any expedition will have its own unique challenges
This is a whistle-stop tour of the form that these various hazards take and what we can do about each of them.
Environmental Issues - Lack of Glaciers
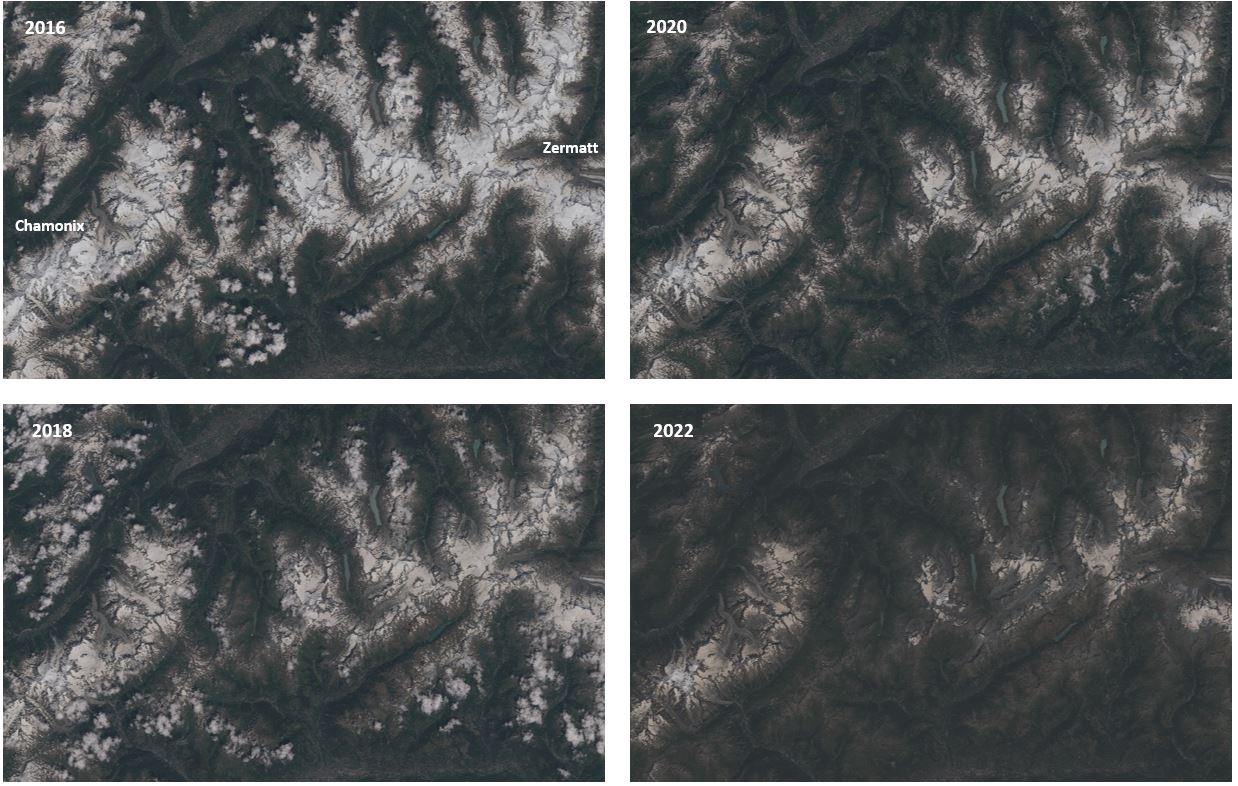
Satellite images showing snowcover in the European Alps between Zermatt and Chamonix in 2016, 2018, 2020 and 2022.
Glacial recession is not news. It's been obvious for some time. But for anyone hoping to measure microplastics using surface snows the size of a glacier is less of a problem than its condition. There has to be some snow to sample.
In what used to be normal conditions, snows in the accumulation zones of high altitude glaciers were perfect natural repositories of atmospheric microplastics. Snows would build up over the winter, incorporating whatever nanoplastics and microplastics happened to be in the atmosphere. These would then remain until some enterprising explorer came along to sample them in the summer.
Nowadays, however, snowcover is less predictable. In particular, while sampling for microplastics during the HLR 2022 expedition, we sometimes found ourselves walking for miles along completely dry glaciers. 2022 was particularly bad in the European Alps, as shown by the satellite images opposite.
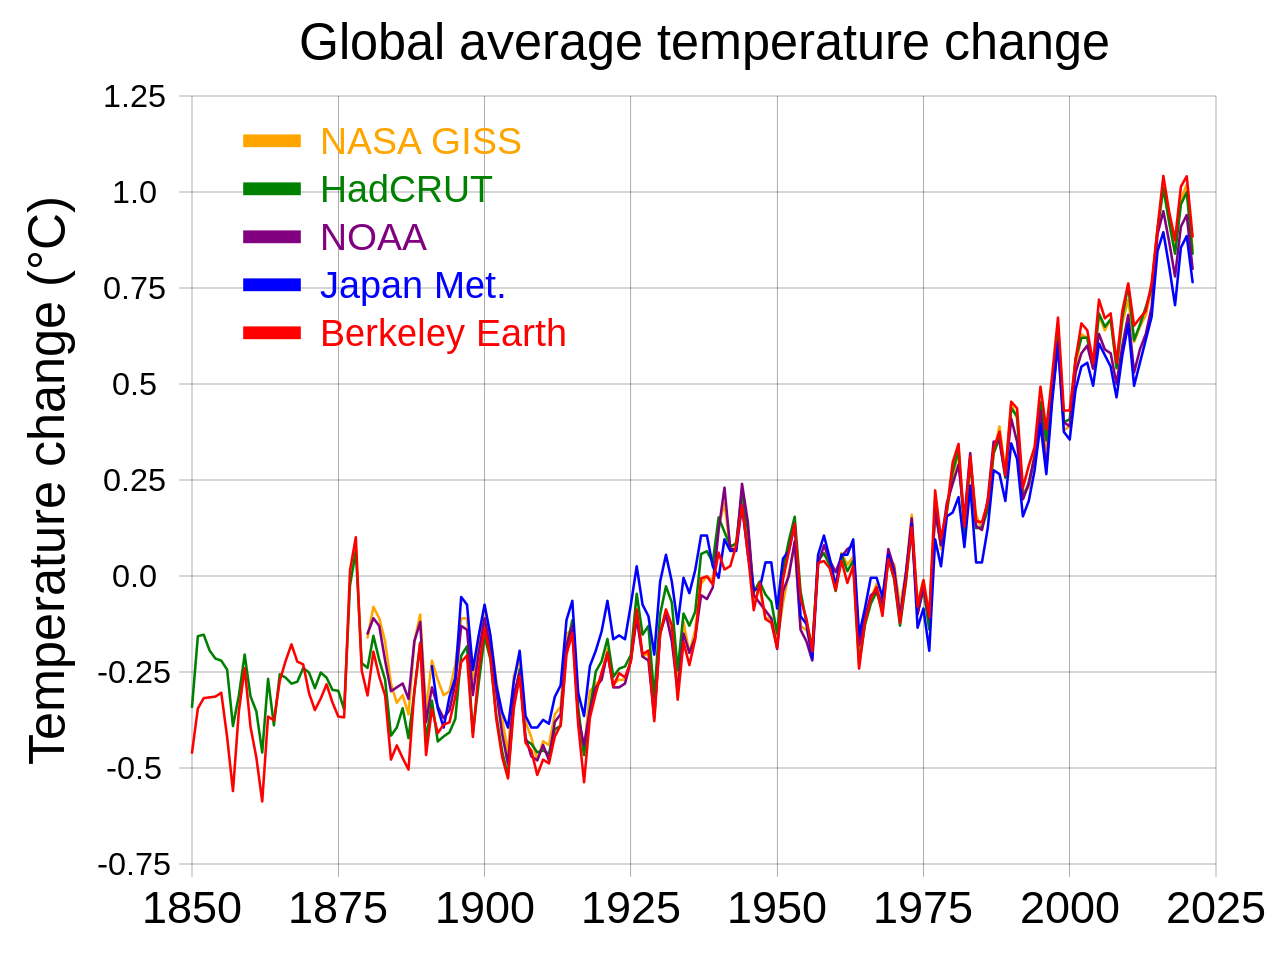
Let's focus just on global warming rather than environmental change in general. The mean global temperature rise since the start of the industrial revolution is a little over 1°C. This has been straightforward to measure thanks to records from weather stations going back to the nineteenth century. A number of different groups have collated this data as shown (see for example the
HADCRUT3 data) and come up with the same result (adjacent).
The basic mechanism is straightforward. Left to its own devices, the earth would reflect roughly 30% of the sun's rays off clouds and reflective surfaces such as mountain snows and polar ice caps while 70% would be absorbed by the land and oceans. Water vapour or gases such as carbon dioxide in the atmosphere, so-called greenhouse gases, act like a kind of insulating blanket for the planet and prevent this heat being radiated away into space. The more greenhouse gases there are, the thicker the metaphorical duvet and the warmer the planet gets.
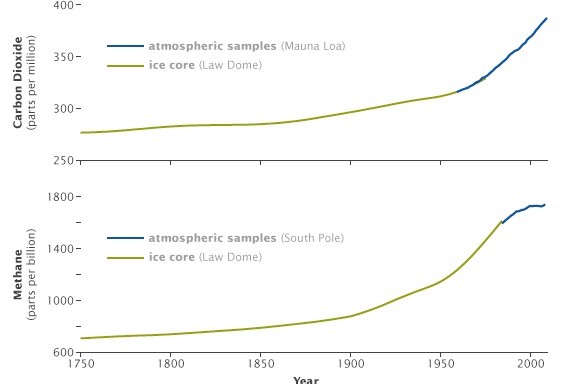
Greenhouse Gases Over the Last 300 Years
The problem is that, since the start of the industrial revolution in the eighteenth century, humanity has been artificially increasing the amount of greenhouse gases in the atmosphere much faster than has ever happened naturally. Roughly 40% of this is from burning fossil fuels for heat, power and transport, 25% from the livestock farming and just under 10% from cement. Arguably, this has been going on since humans began domesticating livestock but it is only recently that the human population has grown enough for this to be significant.
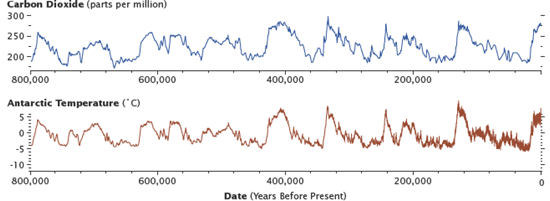
The graphs adjacent show measurements from Antarctic ice cores (green lines) and direct atmospheric measurements (blue lines) from work by NASA's Goddard Center based on data from the U.S. National Oceanic and Atmospheric Administration (NOAA). Just like the increase in the mean global temperature, this has really started to speed up over the last 40-50 years.
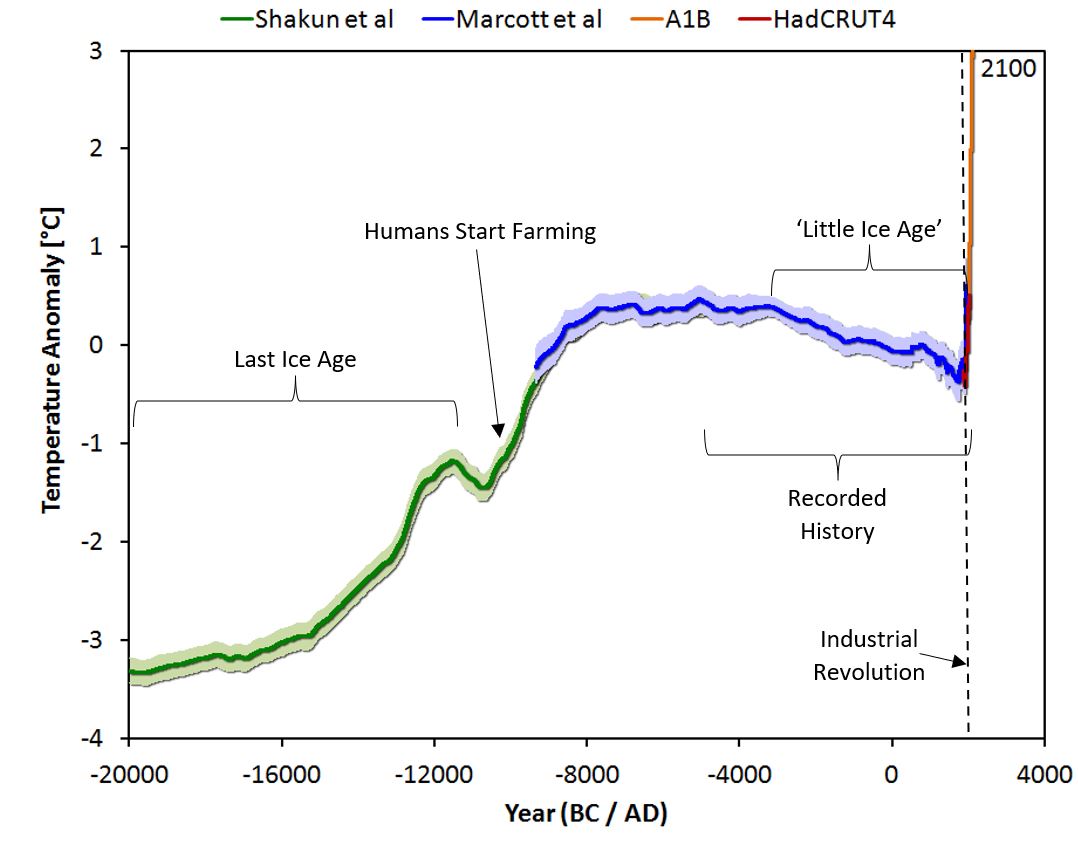
Of course, this temperature increase should be seen in the context of longer term trends. Although people have only been measuring temperature systematically since the nineteenth century, there are many different ways of inferring average temperatures from other sources which can be used as a proxy for temperature. This allows us to look further back in time. Shakun et al. combined some 80 proxy records and Marcott et al. 73 which takes us back into the last ice age. From the depths of the last ice age to the beginning or recorded history there was a temperature rise of around 3-4°C.
In the context of a 3-4°C temperature rise since the last ice age, a rise of only 1°C does not seem that much. Yes, conditions during the last ice age were very different. They are widely believed to have significantly affected human evolution by, for example, facilitating the dispersal of Homo Sapiens across the globe through land bridges revealed when oceans were contained in ice caps. But one might argue that, if humanity can survive a 4°C rise then a one or even two degree rise should be manageable.
Mean Temperatures Since the Last Ice Age
Even larger fluctuations in average global temperatures are seen over longer time periods. One of the best-known datasets is from the European Project for Ice Coring in Antarctica (EPICA) Jouzel et al.. Based on examining the air trapped in Antarctic ice, this measures only one point on the planet but does have the advangate that it can measure both carbon dioxide levels and temperatures from the same source.
On these time-scales, temperature changes of ten degrees or more are not unusual. Their periodicity shows cycles of 19,000-23,000, 41,000, 100,000 and ~413,000 years. These match the periodicity in changes of the precession or the earth's rotation, the tilt of its axis and the eccentricity of its orbit. Known as Milankovitch cycles, these oscillations in the earth's orbit go a long way towards explaining historical climate change on long time-scales.
This does not necessarily mean that natural climate change is always slow. On the contrary, there is a growing body of evidence that the planet may flip-flop from one state to another. This is not entirely unexpected. A common feature of complex systems with multiple interconnected moving parts whose behaviour can feedback from one to the other is that they often display unstable behaviour. As we understand the various measures of historic temperature better, it is looking increasingly likely that some historic changes of climate have been of exactly this type.
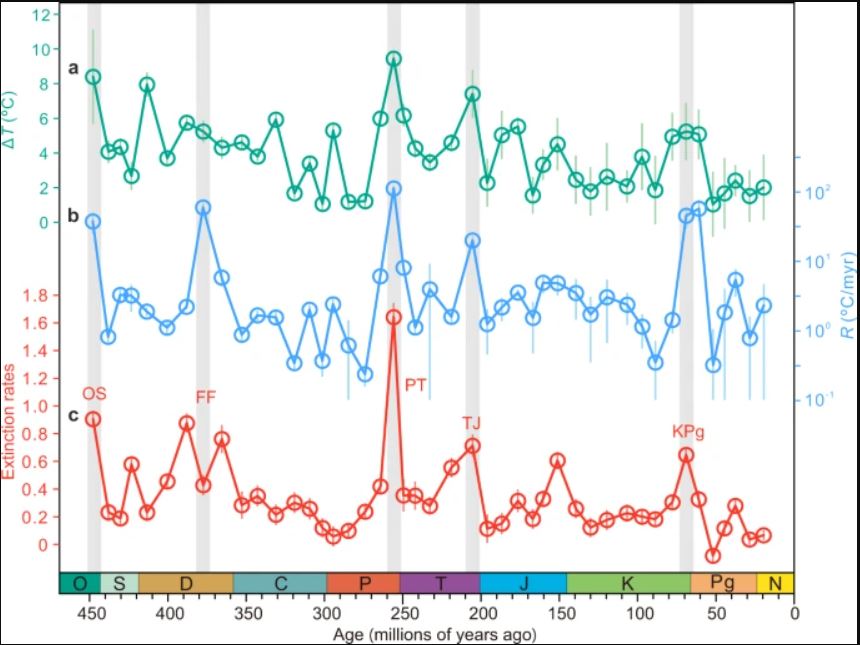
To see the effect of this on 'life as we know it', we can look in the fossil record. A 2021 paper in Nature compared the magnitudes and rate of temperature change with the extinction rates of marine fossils over the last 450 million years. While correlation does not necessarily imply causation, it doesn't refute it either.
Other Places to Read About Global Warming
A number of organisations have written about global warming in more detail. Readable summaries have been published by the UN's IPCC and by the Royal Society which is supported by a variety of disparate sources and has remained independent throughout its entire 350 year history.
Other sources provide better visualisations. NASA, for example, maintains a good overview of climate change. If you want to read what researchers in the field say, check out 'Real Climate Change' which also maintains links to raw datasets and simulation code, or Skeptical Science which is maintained by a U.S. not-for-profit.